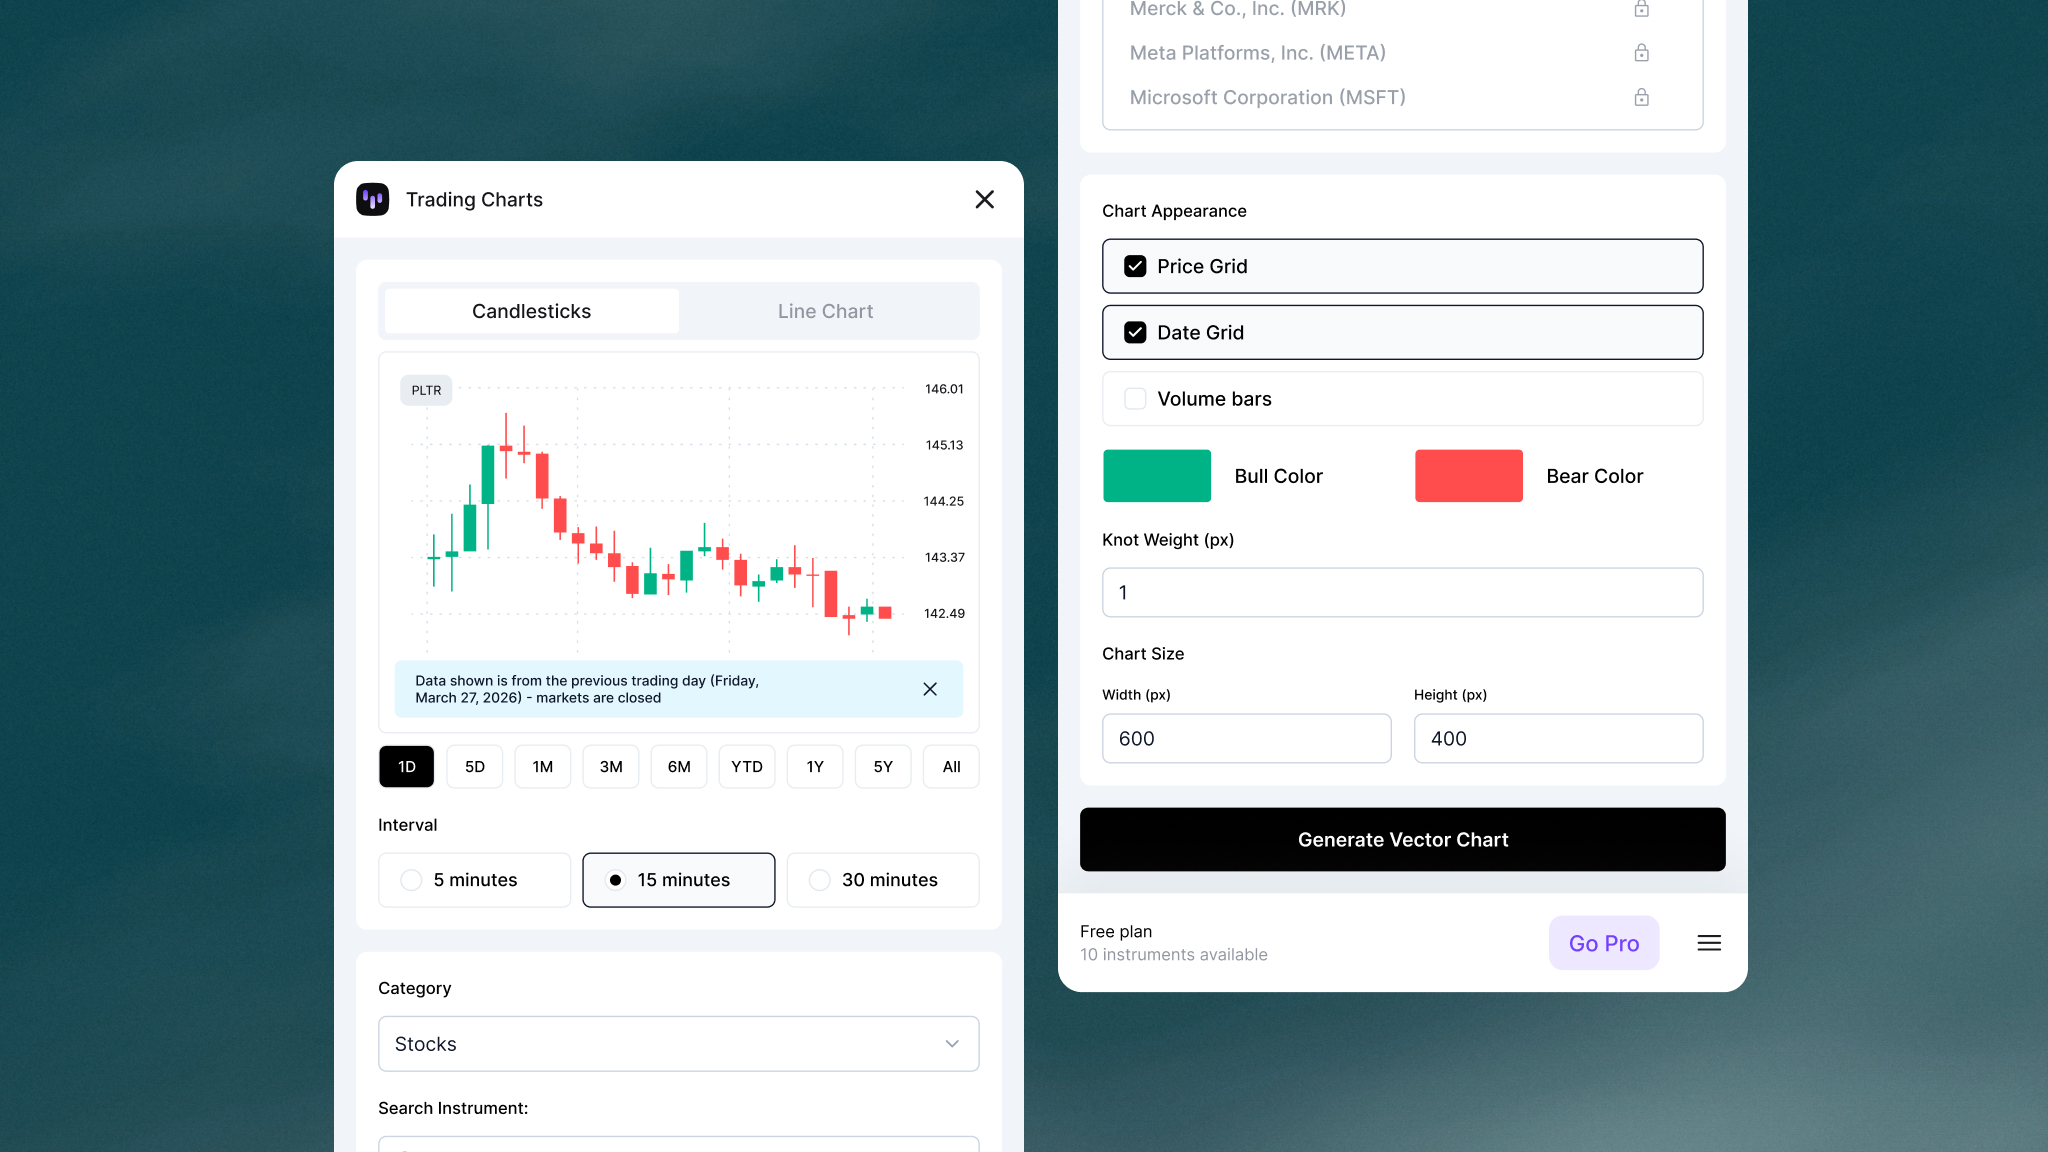
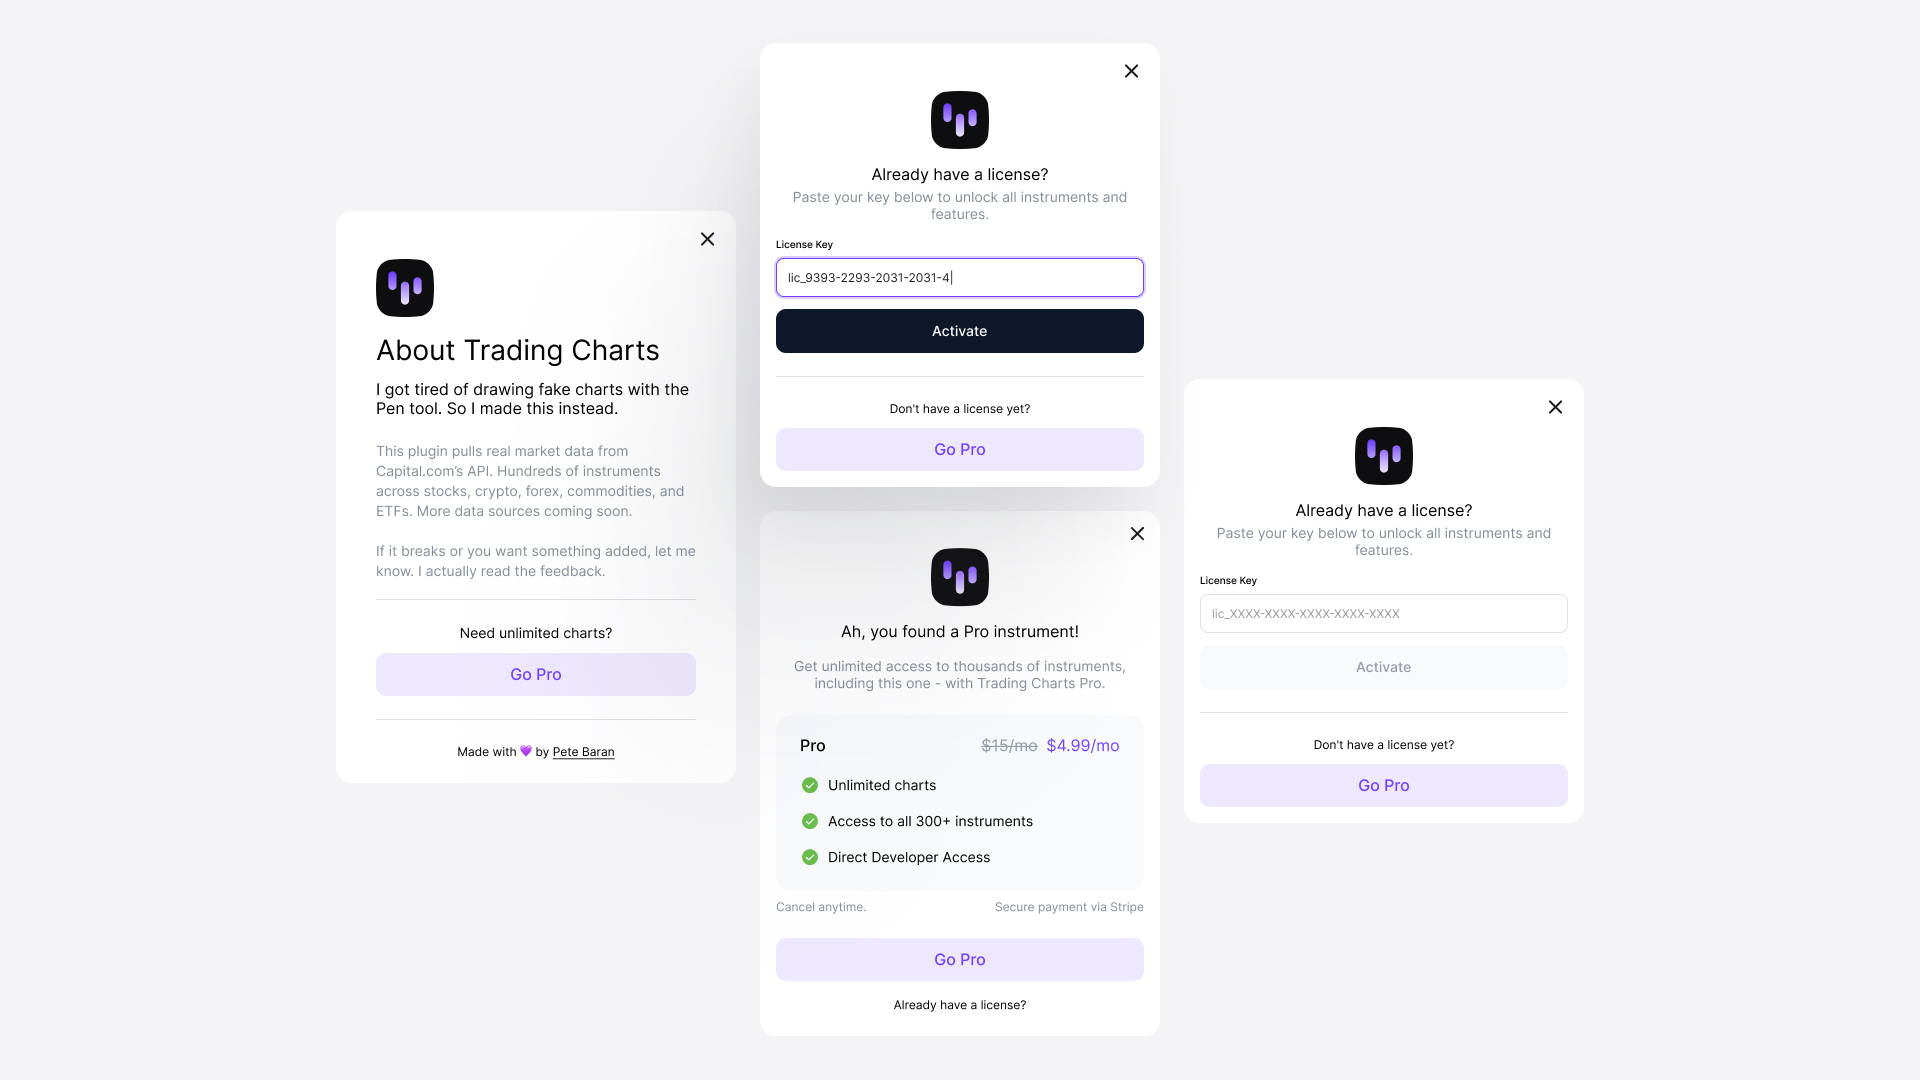
🚀 Trading Charts is live — real market data for your Figma designs →

Trading Charts

A Figma plugin that pulls real market data from hundreds of instruments. Built to solve the fintech designer's most annoying problem: faking chart data.

Trading Charts Figma plugin - Real market data for fintech design mockups

Role

Product Design, Full-Stack Development

Domain

Fintech, Design Tools

Timeline

3-4 weeks

Tools

Figma Plugin API, Cloudflare Workers, Stripe, Capital.com API, Resend

Every fintech designer I know has the same workflow: screenshot a real trading platform, trace over it in Figma, or just make up numbers that look plausible. It's slow, it's inaccurate, and the charts always look slightly wrong.

I built Trading Charts to fix this. Started as an internal tool for my team at Capital.com. Worked so well that I turned it into a commercial product. Now it's live on Figma Community with paying users.

Trading Charts ad showing Figma and plugin icons with text "Finally, trading charts in Figma that don't suck"Trading Charts plugin interface showing Tesla stock chart with search dropdown for stocks, crypto, and forex instruments

The Problem

Fintech designers spend hours creating realistic-looking charts for mockups and pitch decks. The process is painful: screenshot a chart from TradingView, import it into Figma, trace the candlesticks manually, adjust the colors, hope nobody notices the data is from 2019.

Or worse: make up numbers. Pick some fake prices, draw some candles, and pray it looks believable when you present to stakeholders who actually trade.

I did this for years. Every time I needed a Tesla chart, I'd google "TSLA stock chart," grab a screenshot, and spend 20 minutes recreating it. Multiply that across every project, every revision, every A/B test variant.

Brutal.

The Internal Solution

I built the first version for my team at Capital.com. We were designing trading interfaces and needed realistic data fast. The plugin connected to Capital's API and pulled live market data for stocks, crypto, forex, commodities, and ETFs.

Pick an instrument, choose your timeframe, hit generate. Editable vector chart drops onto your canvas with real price data.

Trading Charts Figma plugin full interface showing candlestick chart customization options, timeframe selectors, and instrument search
Complete Trading Charts plugin interface with chart preview, settings panel, and instrument picker

The team started using it immediately. Within two weeks, it became the default way we mocked up charts. No more screenshots. No more fake numbers. Just real data, formatted correctly, ready to design with.

Going Commercial

After seeing how much time it saved internally, I decided to turn it into a product. That meant building all the stuff that makes a plugin feel like an actual service—payments, accounts, emails, the works.

Built the whole thing in three to four weeks. Trading Charts went live on Figma Community in early December.

What It Does

Trading Charts gives you access to hundreds of instruments across stocks, crypto, forex, commodities, and ETFs:

  • Stocks (Apple, Tesla, Nvidia, etc.)
  • Crypto (Bitcoin, Ethereum, Solana)
  • Forex (EUR/USD, GBP/JPY)
  • Commodities (Gold, Oil, Natural Gas)
  • ETFs and Indices

You can generate candlestick charts or line charts, customize intervals from 5 minutes to monthly, adjust colors, toggle grids, and export everything as editable vectors. The charts use real market data, so when you're designing a crypto dashboard or a stock trading app, you're working with actual price movements.

Free tier gives you 5 charts per month. Pro tier is $15/month for unlimited charts. Enterprise is $29/month with priority support.

Multiple trading chart examples generated by Trading Charts plugin showing different stocks, crypto, and forex pairs in Figma
Sample charts generated with Trading Charts

How It Works

The plugin has three main pieces:

1. Plugin Interface (Vite + TypeScript)

Built with Vite and TypeScript, compiling down to a single HTML file that Figma can read. The UI shows a live preview of the chart before you generate it, so you know exactly what you're getting. All the UI code lives in modular TypeScript files that bundle into one artifact.

2. Cloudflare Workers Backend

Two separate workers handle different parts of the system. One proxies requests to Capital.com's API, managing authentication and converting their data format to something the plugin can render. The other handles everything license-related: Stripe payments, subscription webhooks, and validation checks.

3. Chart Generation Engine

The Figma plugin backend (code.js) takes the data and generates vector charts directly in your Figma file. It calculates layouts dynamically based on price label widths, positions candlesticks or line segments, adds grids and axes, and outputs everything as editable vector shapes you can customize.

Sessions with Capital.com's API last 10 minutes and get cached for 9 minutes to avoid hitting rate limits. If a data resolution isn't available for a specific instrument, the system automatically falls back to the next best option (e.g., 5-minute → 15-minute → 30-minute intervals).

Current Status

Trading Charts is live on Figma Community. I'm adding more data sources and working on a feature that lets you overlay multiple instruments on one chart.

If you design fintech interfaces, go try it. If you don't, at least you know designers can ship full-stack products now.

More Projects

The Coin

A brand visual system built around an abstract gold coin - no king's face, no institution, just pure form. The symbol of access to markets.

Gen AI commercial still showing athlete in intense close-up during tennis training

Gen AI Commercials

How I produced broadcast-quality brand campaigns using VEO3, ElevenLabs, and Claude. No cameras, just prompts and scripts.